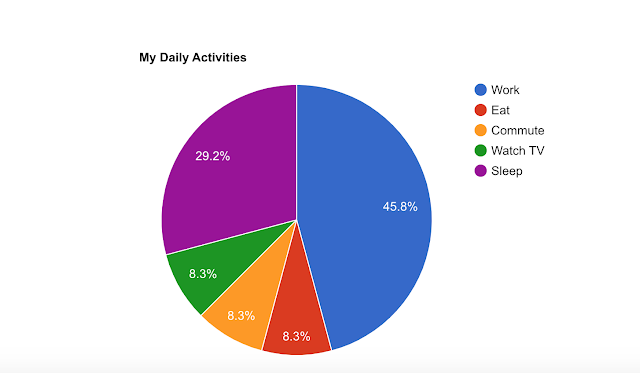
Google Charts is a JavaScript library that allows you to create interactive charts and graphs on your website. Google Charts supports a wide variety of chart types, including line charts, bar charts, pie charts, and scatterplots.
Charts can be a powerful way to communicate data and tell a story. They can help you to:
- Highlight trends: Charts can help you to identify trends in your data. For example, you could use a line chart to show how sales have increased over time.
- Compare values: Charts can help you to compare values between different categories. For example, you could use a bar chart to compare the sales of different products.
- Visualize data: Charts can help you to visualize data in a way that is easy to understand. For example, you could use a pie chart to show the composition of a whole.
If you are looking for a way to add interactivity and visual appeal to your website, Google Charts is a great option. With Google Charts, you can create charts that are easy to create, customize, and embed.
How to Use Google Charts
To use Google Charts, you first need to create a data table. A data table is a two-dimensional array of data. The first dimension of the array represents the rows of the chart, and the second dimension represents the columns of the chart.
Once you have created a data table, you can use the Google Charts API to create a chart. The Google Charts API provides a variety of methods for creating charts. The most common method is the draw() method.
The draw() method takes two arguments: the first argument is the ID of the element in which you want to draw the chart, and the second argument is the data table that you created in the previous step.
For example, the following code creates a line chart and draws it in an element with the ID chart1:
var data = [
  [1, 2],
  [3, 4],
  [5, 6],
  [7, 8],
  [9, 10]
];

google.charts.load('current', {'packages':['corechart']});
google.charts.setOnLoadCallback(drawChart);

function drawChart() {
  var chart = new google.visualization.LineChart(document.getElementById('chart1'));
  chart.draw(data, {title: 'My First Chart'});
}
Customizing Google Charts
You can customize Google Charts to match your specific needs. You can change the colors, fonts, and labels of your charts. You can also add interactivity to your charts by adding events and tooltips.
To customize a Google Chart, you can use the options object. The options object is a JavaScript object that contains the properties of your chart.
For example, the following code changes the color of the bars in a bar chart to red:
var data = [
  ['Red', 10],
  ['Blue', 20],
  ['Green', 30]
];

google.charts.load('current', {'packages':['corechart']});
google.charts.setOnLoadCallback(drawChart);

function drawChart() {
  var chart = new google.visualization.BarChart(document.getElementById('chart1'));
  chart.draw(data, {options: {colors: ['red']}});
}
Embedding Google Charts in Your Website
Once you have created your Google Chart, you can embed it in your website using the Google Charts JavaScript library.
To embed a Google Chart in your website, you first need to create an element with the ID that you specified in the draw() method. Then, you can use the src attribute of the element to specify the URL of the chart.
<html>
  <head>
    <script type="text/javascript" src="https://www.gstatic.com/charts/loader.js"></script>
    <script type="text/javascript">
      google.charts.load('current', {'packages':['corechart']});
      google.charts.setOnLoadCallback(drawChart);

      function drawChart() {

        var data = google.visualization.arrayToDataTable([
          ['Task', 'Hours per Day'],
          ['Work',     11],
          ['Eat',      2],
          ['Commute',  2],
          ['Watch TV', 2],
          ['Sleep',    7]
        ]);

        var options = {
          title: 'My Daily Activities'
        };

        var chart = new google.visualization.PieChart(document.getElementById('chart1'));

        chart.draw(data, options);
      }
    </script>
  </head>
  <body>
    <div id="chart1" style="width: 900px; height: 500px;"></div>
  </body>
</html>

